Hello,Attached are the Q2 Agent Metrics Report, the Fresno and Clovis Sales Tracking Google Sheet, detailed commentary, and a curated collection of real estate and finance articles. I hope these

Dated: March 9 2026
Views: 2
Hello,
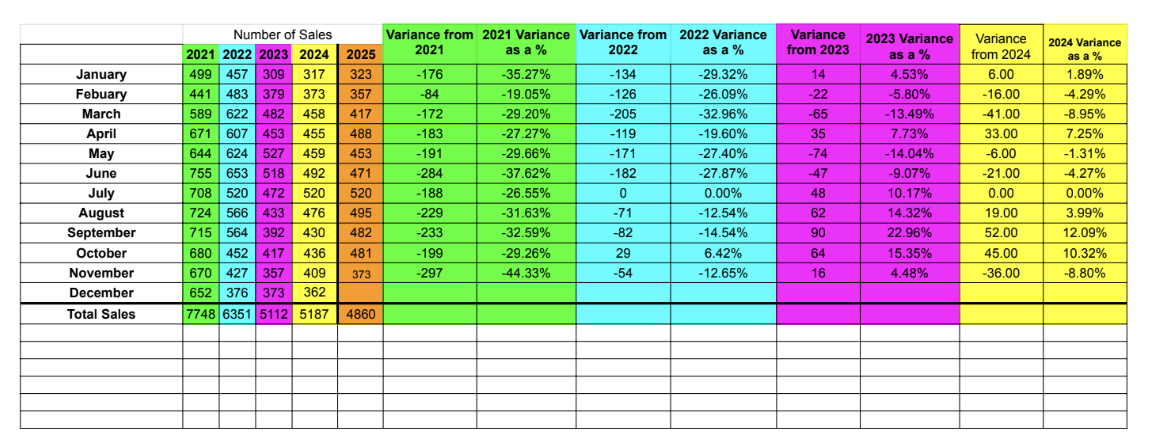
Attached are November’s Agent Metrics Report, the Fresno and Clovis Sales Tracking Google Sheet, detailed commentary, and a collection of real estate and finance articles. I trust these resources will provide useful insights to support your continued success.
Fresno and Clovis Real Estate Market Update: November 2025
Key Highlights:
Median Sold Price: increased to $445,983 in November 2025, up from $438,065 in October 2025 (1,8075%).
Homes Sold:
373 homes sold in November 2025, down (-22.45%) from 482 in October 2025 (109 fewer homes sold in November than in October)
373 homes sold in November 2025, down (-14.05%) from 434 in November 2024 (70 fewer homes).
Average Days on Market (DOM):
November 2025: 43 days, up from October 2025 (34).
Homes with no price changes: 19 days.
Homes with 1+ price changes: 74 days.
Sales Price vs. Offer Price:
Homes with no price changes: 99.2%.
Homes with 1+ price changes: 94.0%.
Median For-Sale Price: $497,679 vs. Median Sold Price: $445,983.
Bank-Owned Properties: 1 sold in November 2025, down from 4 Other Real Estate Owned (OREO) sales in October 2025.
Pending Sales: In November 407 homes went under contract (versus 449 Pending Sales in October), signaling potentially fewer closings in December than in November.
New Listings: 413 new properties were listed for sale.
Months’ Supply of Inventory (MSI): 2.8 months in November 2025, indicating a tight market.
Inventory Trends:
2025 Local MSI:
January: 2.7 (vs. NAR: 3.2)
February: 2.5 (vs. NAR: 3.0)
March: 1.9 (vs. NAR: 2.4)
April: 2.6 (vs. NAR: 2.4)
May: 2.6 (vs. NAR: 2.8)
June: 2.5 (vs. NAR: 2.9)
July: 2.6 (vs. NAR: 2.6)
August: 2.1 (vs. NAR: 2.5)
September: 2.5 (vs. NAR: 2.6)
October: 3.0 (vs. NAR: 2.8)
November: 2.8 (vs. NAR: 3.1)
2024 Local MSI (for comparison):
January: 1.9 (vs. NAR: 2.6)
February: 2.1 (vs. NAR: 2.2)
March: 1.8 (vs. NAR: 1.8)
April: 2.0 (vs. NAR: 2.0)
May: 2.0 (vs. NAR: 2.2)
June: 2.4 (vs. NAR: 2.1)
July: 2.1 (vs. NAR: 2.0)
August: 2.1 (vs. NAR: 2.2)
September: 2.7 (vs. NAR: 2.6)
October: 2.4 (vs. NAR: 2.6)
November: 2.7 (vs. NAR: 2.5)
December: 2.7 (vs. NAR: 2.4)
Market Insight:
The Fresno and Clovis housing markets continue to grapple with limited inventory, though supply is slowly increasing. With the Months’ Supply of Inventory at 2.8 months (down from October), the market remains competitive and continues to favor sellers. The drop in pending sales and the level of new listings suggest a potential slight decrease in closings for December compared to November.
Commentary: A Fickle Society
Housing affordability has dominated headlines for years, with a steady stream of alarming reports underscoring the crisis. Here are a few recent examples of headlines that illustrate the depth of concern:
Nearly 60% of U.S. households cannot afford a $300,000 home (NAHB, March 2025)
20 signs of an affordability crisis in America (Forbes, December 2025)
New report highlights growing unease amid a worsening affordability crisis (Harvard Joint Center for Housing Studies, 2025)
Asking rents reach 30-month high (The Mortgage Point, August 2025)
Well-intended laws, higher rents: A data-driven analysis (HousingWire, September 2025) — examining how regulations contribute to rent increases
Behind the high cost of rent (National Multifamily Housing Council/National Apartment Association, 2025) — detailing the impact of local regulations on rental costs
Given this widespread national attention, why has the problem persisted? In the wealthiest and most innovative nation on earth, why does a basic human need like housing remain out of reach for so many?
Policymakers often turn to rent control as a quick fix, believing that capping price increases will restore affordability. California’s AB 1482 limits annual rent hikes to 5% plus CPI, while St. Paul, Minnesota’s 2022 Residential Rent Stabilization Ordinance capped increases at 3% for most units, even vacant ones. Yet these policies confuse affordability with availability. In California, landlords subject only to the statewide cap (without stricter local rules) frequently raise rents to the maximum each year simply to preserve property values.
Fair Market Rent (FMR) trends for a typical two-bedroom unit in Fresno provide a clear benchmark:
● 2020: $980
● 2021: $1,064 (+8.6%)
● 2022: $1,137 (+6.9%)
● 2023: $1,258 (+10.6%)
● 2024: $1,443 (+14.7%)
● 2025: $1,505 (+4.3%)
That represents a cumulative increase of approximately 53% from 2020 to 2025.
In Fresno today (Dec. 2025), market rents for two-bedroom apartments can range from $1,300–$2,200, a sharp surge since 2020. My hypothesis is that before AB 1482, many Fresno landlords rarely raised rents, preferring stable tenancy to avoid costly turnover. However, since the law’s passage, they have felt compelled to apply the maximum allowable increase annually.
A St. Paul, Minnesota property manager captured this shift perfectly in a recent article: She once kept rent increases well below 3%, but now applies the full rent cap every year. The root problem is not price, it is supply. The only durable solution to both availability and affordability is to build much more housing, even though it is inherently a long-term endeavor. When St. Paul approved rent control, the builders and investors left. They crossed the Mississippi to Minneapolis. Now, Minneapolis, a city without rent control, has a booming housing market, plenty of apartments and a bustling economy. Rent control isn't an issue when housing is plentiful.
Locally, Fresno’s proposed Southeast Development Area (SEDA) plan could deliver up to 45,000 new homes by 2050. Yet public opposition has been fierce. If we don’t build, where will people live? Housing is one of our greatest needs.
We are profoundly fickle. We complain bitterly when rents and home prices soar, yet we vehemently resist the very developments needed to alleviate the shortage. In the end, we are our own worst obstacle.
For deeper insight, I recommend two key readings:
“The Effects of Rent Control Expansion on Tenants, Landlords, and Inequality: Evidence from San Francisco” by Rebecca Diamond, Tim McQuade, and Franklin Qian (March 4, 2019) – a rigorous study showing unintended consequences of strict rent control.
“Dueling approaches over how to fix America’s housing crisis are splitting Minnesota’s Twin Cities” by Rebecca Picciotto – a clear comparison of rent-control vs. supply-focused strategies in Minneapolis and St. Paul.
Articles/Interviews/Presentations/Books that may be of interest:

Jared Martin is a Central Valley real estate broker and one of the owners of Aquailos Inc., an independently owned real estate company based in Fresno, California. As a third-generation, active REALTO....
Hello,Attached are the Q2 Agent Metrics Report, the Fresno and Clovis Sales Tracking Google Sheet, detailed commentary, and a curated collection of real estate and finance articles. I hope these
Hello,Attached are the Q1 2026 Agent Metrics Report (now provided quarterly), the updated Fresno and Clovis Sales Tracking Google Sheet, detailed commentary, and a collection of real estate and
Hello, Attached are December’s Agent Metrics Report, the Fresno and Clovis Sales Tracking Google Sheet, detailed commentary, and a collection of real estate and finance articles. I trust
Hello,Attached are November’s Agent Metrics Report, the Fresno and Clovis Sales Tracking Google Sheet, detailed commentary, and a collection of real estate and finance articles. I trust these
 © 2026 Fresno Association of REALTORS ®. All rights reserved. The data relating to real estate for sale on this web site comes in part from the Internet Data eXchange (IDX) of the Multiple Listing Service. Real estate listings held by brokerage firms other than Central California Real Estate Pros are marked with the IDX logo and detailed information about them includes the name of the listing broker and the name of the listing agent.
All data, including all measurements and calculations
of area, is obtained from various sources and has not been, and will not be, verified by broker or MLS. All information should be independently reviewed and verified for accuracy. Properties may or may not be listed by the office/agent presenting the information.
Show More...
© 2026 Fresno Association of REALTORS ®. All rights reserved. The data relating to real estate for sale on this web site comes in part from the Internet Data eXchange (IDX) of the Multiple Listing Service. Real estate listings held by brokerage firms other than Central California Real Estate Pros are marked with the IDX logo and detailed information about them includes the name of the listing broker and the name of the listing agent.
All data, including all measurements and calculations
of area, is obtained from various sources and has not been, and will not be, verified by broker or MLS. All information should be independently reviewed and verified for accuracy. Properties may or may not be listed by the office/agent presenting the information.
Show More...
